- Operational Dashboard
Operational Dashboard
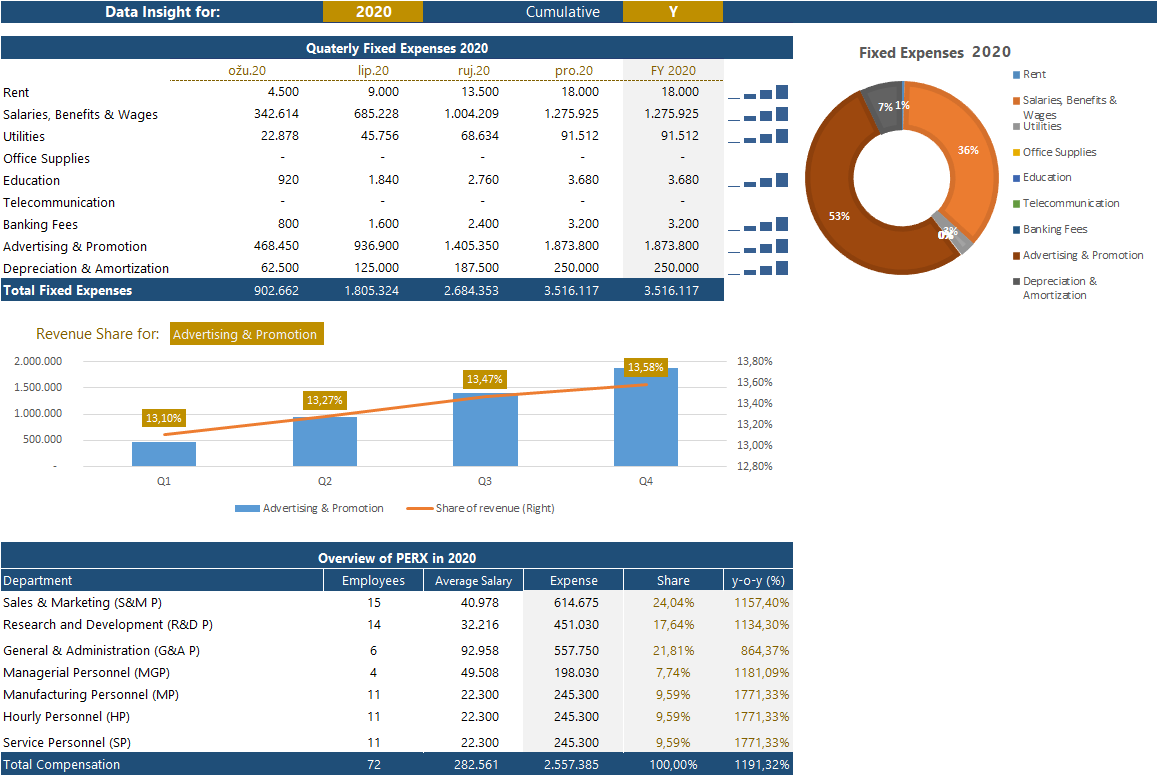
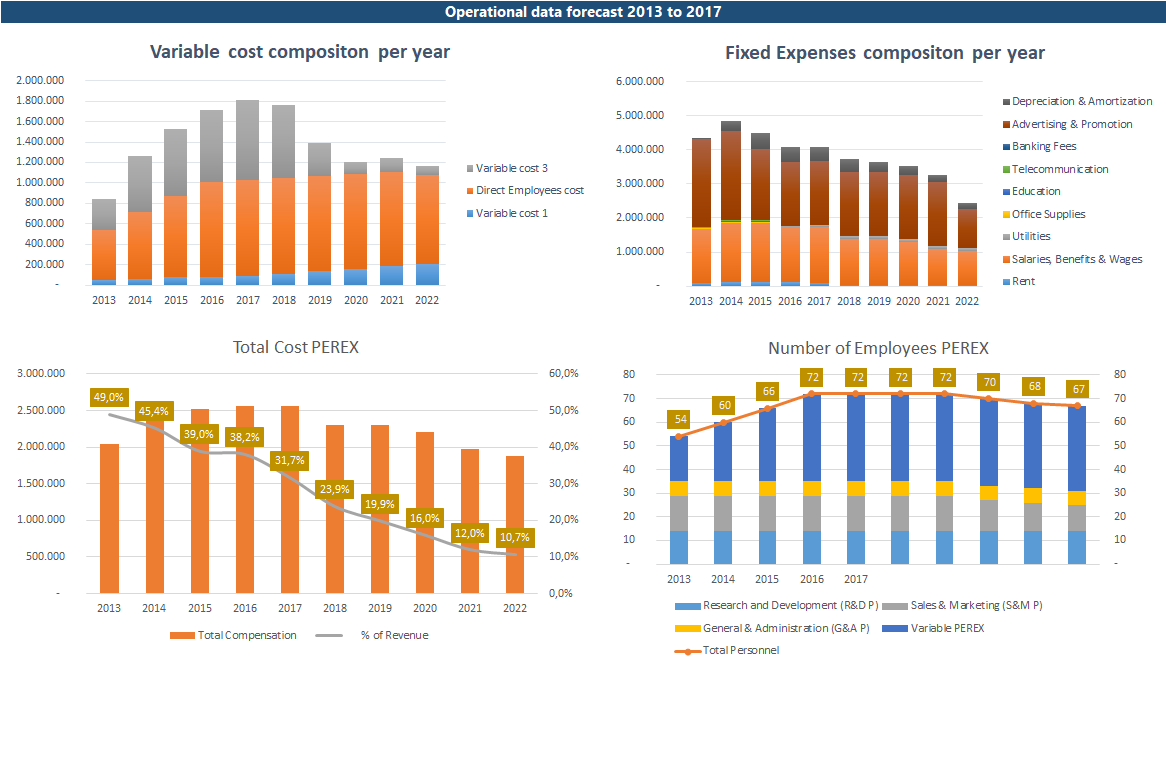
Operational Dashboard gives you more insight into estimated fixed OPEX on a quarterly level for each year. Also, it visually displays the composition of variable and fixed and employee expenses throughout the planned period.
Main features
- Overview of quarterly fixed expenses.
- Choose a cumulative or each quarter by quater view.
- Visual diagram of expenses to revenue ratio on quarterly bases
- Composition of employees headcount, average salary, yearly expense, and share.
Dynamic Dashboard
The right side of the Operational Dashboard gives insight into an estimate of fixed expenses every quarter for each year. You can choose cumulative or quarter by the quarter view. Data insight visually displays an expense to revenue ratio for every fixed OPEX every quarter.
In addition to that, we provided PEREX data with employees' data for chosen year sorted by respective company departments.
In addition to that, we provided PEREX data with employees' data for chosen year sorted by respective company departments.
Dynamic Dashboard
Yearly overview
The left side of the Operational Dashboard gives an overall view of the composition of variable and fixed costs over the planned period. Also, you can see how you planned an increase in employees over time and what is the employee cost per department.
Also, you can track the PEREX cost to revenue ratio overtime to find the right growth target. If you want to see monthly data for each respective year, you can see the Profit & Loss Account
Also, you can track the PEREX cost to revenue ratio overtime to find the right growth target. If you want to see monthly data for each respective year, you can see the Profit & Loss Account


